DSBN 2026/2027 Annual Budget
The District School Board of Niagara (DSBN) Board of Trustees approved a balanced 2026-2027 budget of $677,740,260, an increase of $11.0 million from the previous year.
“Grounded in careful planning, detailed analysis and a strong understanding of both system needs and funding parameters, the 2026-2027 budget reflects our ongoing commitment to making thoughtful decisions that support student achievement and well-being.”
“Alongside learning opportunities that connect students to their interests and future goals, this budget includes more than $124 million for school renovations, major system upgrades and the construction of three new elementary schools. These investments help ensure students continue to learn in safe and modern environments that help them thrive.”
“Approving a balanced budget means carefully weighing priorities and making thoughtful decisions. This budget reflects that work and our shared commitment to accountability, transparency and student success.”

Aligned with DSBN’s Strategic Plan
Developed through a comprehensive planning process, the budget aligns financial resources with our Strategic Plan and priorities, reflecting continued investment in student achievement, well-being and system sustainability while responding to ongoing financial pressures.
DSBN’s 2023-2028 Strategic Plan

Day School Enrolment
| DSBN | 2025/2026Actual | 2026/2027Projected |
|---|---|---|
| Elementary | ||
| Kindergarten | 5,297 | 5,212 |
| Grades 1-3 | 9,123 | 8,996 |
| Grades 4-8 | 15,664 | 16,052 |
| 30,084 | 30,260 | |
| Secondary | ||
| Adolescents (<21) | 13,109 | 13,230 |
| High Credit (<21) | 15 | 29 |
| Adults (>20) | 8 | - |
| 13,132 | 13,259 | |
| TOTAL AVERAGE DAILY ENROLMENT | 43,216 | 43,519 |
Note: 2025-26 actual is based on October 31, 2025 actuals and March 31, 2026 preliminary actuals.
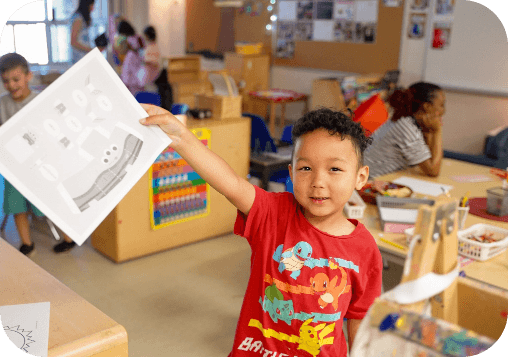
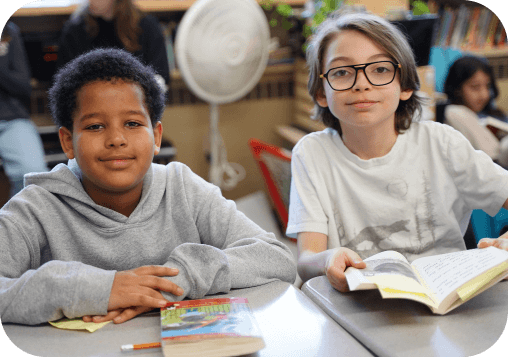
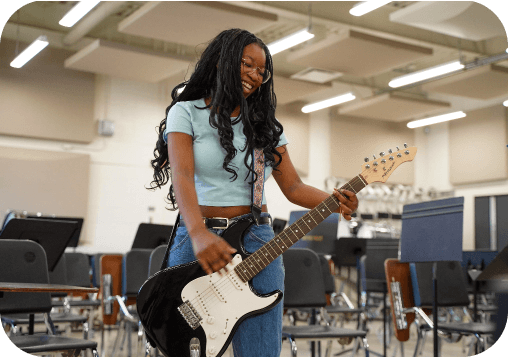
RESOURCES DIRECTED TO WHERE THEY ARE NEEDED MOST
Student-Focused Approach
Informed by enrolment, program requirements and school-based needs, staffing investments have been made to maintain strong classroom supports and ensure students have access to responsive and engaging learning environments.
Summary of Revenue
| Budget | 2026-27Budget$ | 2025-26Budget$ | Variance$ |
|---|---|---|---|
| Core Education Funding | |||
| Classroom Staffing Fund (CSF) | 340,206,530 | 337,616,665 | 2,589,865 |
| Learning Resources Fund (LRF) | 95,746,154 | 90,640,650 | 5,105,504 |
| Special Education Fund (SEF) | 78,928,571 | 77,849,675 | 1,078,896 |
| School Facilities Fund (SFF) | 52,021,630 | 51,955,432 | 66,198 |
| Student Transportation Fund (STF) | 31,331,484 | 27,197,320 | 4,134,164 |
| School Board Administration Fund (SBAF) | 13,512,674 | 13,417,660 | 95,014 |
| Capital Funding & Deferred Capital Contributions | 47,587,763 | 49,982,716 | (2,394,953) |
| 659,334,806 | 648,660,118 | 10,674,688 | |
| OTHER REVENUES | |||
| Responsive Education Programs | 440,278 | 4,746,985 | (4,306,707) |
| Non-Resident Student Fees | 343,800 | 1,159,350 | (815,550) |
| Continuing Education | 969,251 | 918,244 | 51,007 |
| Community Use of Schools | 985,216 | 905,600 | 79,616 |
| Interest Income | 2,000,000 | 2,400,000 | (400,000) |
| Miscellaneous | 454,000 | 442,000 | 12,000 |
| School Generated Funds | 13,212,909 | 7,519,207 | 5,693,702 |
| 18,405,454 | 18,091,386 | 314,068 | |
| TOTAL REVENUE | 677,740,260 | 666,751,504 | 10,988,756 |
DSBN REMAINS COMMITTED TO
Strengthening the Learning Experience
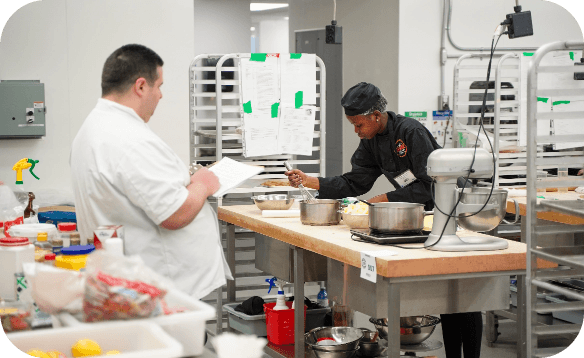
From expanding Specialist High Skills Major (SHSM) hospitality programs in our secondary schools to investing more than $2 million in information technology infrastructure, we are strengthening the learning experience in our schools.
Summary of Expenditures
| Budget | 2026-27Budget$ | 2025-26Budget$ | Variance$ |
|---|---|---|---|
| CLASSROOM INSTRUCTION | |||
| Classroom Teachers | 337,672,704 | 335,439,423 | 2,233,281 |
| Supply Staff | 11,704,842 | 11,494,736 | 210,106 |
| Educational Assistants | 33,461,724 | 32,256,642 | 1,205,082 |
| Early Childhood Educators | 12,860,600 | 12,830,625 | 29,975 |
| Textbooks & Classroom Supplies | 14,101,573 | 13,049,561 | 1,052,012 |
| Computers | 5,006,998 | 5,498,803 | (491,805) |
| Professional & Para-professional | 25,692,046 | 23,400,134 | 2,291,912 |
| Library & Guidance | 10,546,460 | 10,235,364 | 311,096 |
| Professional Development | 2,554,774 | 3,061,345 | (506,571) |
| Program Leaders | 546,423 | 542,446 | 3,977 |
| 454,148,144 | 447,809,079 | 6,339,065 | |
| NON-CLASSROOM | |||
| In-School Administration | 37,922,423 | 36,680,128 | 1,242,295 |
| Instructional Support | 10,909,203 | 15,273,802 | (4,364,599) |
| Board Administration | 15,945,882 | 15,731,110 | 214,772 |
| School Operations | 59,595,980 | 57,700,557 | 1,895,423 |
| Community Education | 2,445,658 | 2,430,352 | 15,306 |
| Transportation | 31,498,696 | 29,732,312 | 1,766,384 |
| 158,317,842 | 157,548,261 | 769,581 | |
| Other | |||
| School Generated Funds | 13,212,909 | 7,519,207 | 5,693,702 |
| Amortization of Tangible Capital Assets | 45,887,059 | 48,144,984 | (1,707,078) |
| Capital Debt Charges | 5,623,459 | 5,329,973 | 293,486 |
| Provision for Committee Capital | 550,847 | 400,000 | (400,000) |
| 65,274,274 | 61,394,164 | 3,880,110 | |
| TOTAL EXPENDITURES | 677,740,260 | 666,751,504 | 10,988,756 |
PROFESSIONAL LEARNING FOR SYSTEM-WIDE IMPACT
Investing in Educators
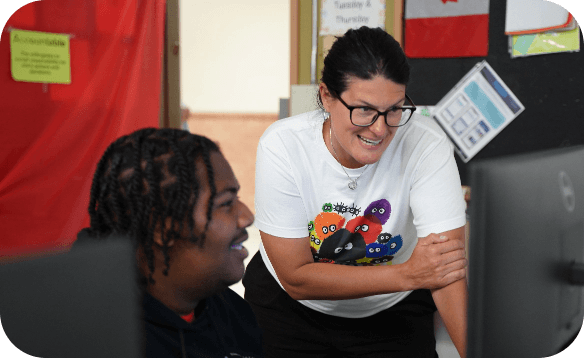
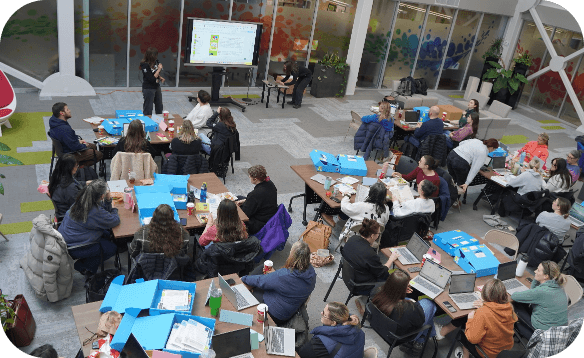
In the 2025-2026 school year, 240 educators deepened their professional learning through Additional Qualification (AQ) courses offered within our system. Designed and facilitated by DSBN educators using a blended learning model, these courses provide practical, classroom-ready strategies across both elementary and secondary panels, helping educators strengthen their instructional practice and better meet the needs of every learner.
Expenditures By Type
| Budget | 2026-27Budget$ | 2025-26Budget$ | Variance$ |
|---|---|---|---|
| EXPENDITURES | |||
| Salaries | 450,415,662 | 448,584,043 | 1,831,619 |
| Benefits | 80,510,138 | 79,680,213 | 829,925 |
| Professional Development | 1,741,355 | 1,936,077 | (194,722) |
| Supplies & Services | 35,406,223 | 35,515,570 | (109,347) |
| Debt Charges & Interest | 5,623,459 | 5,329,973 | 293,486 |
| Fees & Contractual Services | 43,818,309 | 39,461,075 | 4,357,234 |
| Amortization of Tangible Capital Assets | 45,887,059 | 48,144,984 | (2,257,925) |
| School Generated Funds | 13,212,909 | 7,519,207 | 5,693,702 |
| Miscellaneous | 1,125,146 | 580,362 | 544,784 |
| TOTAL EXPENDITURES | 677,740,260 | 666,751,504 | 10,988,756 |
PUTTING STUDENTS FIRST
Supporting Learning & Well-Being
Additional investments have been made to enhance supports for students with special education needs and strengthen student mental health services. These investments will strengthen school-based supports, enhance access to timely interventions and ensure the system continues to respond effectively and compassionately.

Special Education
| Budget | FTE | 2026-27 Budget$ | FTE | 2025-26 Budget$ |
|---|---|---|---|---|
| SPECIAL EDUCATION REVENUE | 85,181,910 | 84,346,477 | ||
| School Administered Costs | ||||
| Classroom Teachers | 101.0 | 12,967,005 | 102.6 | 13,109,079 |
| Learning Resource Teachers | 133.5 | 17,059,046 | 133.8 | 17,014,808 |
| Educational Assistants | 506.0 | 32,627,405 | 492.0 | 31,848,266 |
| Feeders | 12.0 | 403,584 | 9.0 | 301,106 |
| Bus Monitors/Riders | 1,111,863 | 825,353 | ||
| Staff Replacement Coverage | 2,219,504 | 2,330,371 | ||
| TOTAL SCHOOL ADMINISTERED COSTS | 752.5 | 66,388,407 | 737.4 | 65,428,983 |
| Centrally Administered Costs | ||||
| Salaries and Benefits | ||||
| Consultants | 9.0 | 1,323,569 | 11.0 | 1,613,078 |
| Applied Behaviour Analysis Facilitators | 8.0 | 1,035,712 | 8.0 | 1,028,864 |
| Administrators | 3.0 | 556,751 | 3.0 | 560,680 |
| Speech Language Pathologists | 6.0 | 798,302 | 7.0 | 909,628 |
| Educational Assistants | 14.0 | 1,021,758 | 11.5 | 857,885 |
| Youth Counsellors | 26.0 | 2,485,354 | 26.0 | 2,460,370 |
| Social Workers | 30.0 | 3,984,349 | 29.0 | 3,829,440 |
| Other | 11.0 | 1,189,516 | 13.0 | 1,238,486 |
| Clerical and Secretarial | 4.0 | 309,427 | 5.0 | 383,191 |
| TOTAL SALARIES AND BENEFITS | 111.0 | 12,704,738 | 113.5 | 12,881,622 |
| Special Equipment Expenses | ||||
| Educational Assistant - SEA | 4.0 | 279,621 | 3.5 | 256,164 |
| SEA Supervisor | 1.0 | 136,898 | 1.0 | 130,903 |
| Computer Technicians | 2.0 | 207,774 | 2.0 | 196,460 |
| Supply Coverage | 25,000 | 40,000 | ||
| Computer Technology & Software | 245,000 | 50,000 | ||
| Personalized Equipment - Assistive Technology | 1,068,942 | 1,168,942 | ||
| Personalized Equipment - Claims | 220,277 | 220,277 | ||
| TOTAL SPECIAL EQUIPMENT EXPENSES | 7.0 | 2,183,512 | 6.5 | 2,062,746 |
| OTHER EXPENSES | 1,565,428 | 1,459,297 | ||
| TOTAL CENTRALLY ADMINISTERED COSTS | 118.0 | 16,453,678 | 120.0 | 16,403,665 |
| EDUCATION AND COMMUNITY PARTNERSHIP PROGRAM (ECPP) & CARE AND TREATMENT EDUCATION PROGRAMS (CTEP) | 3,571,769 | 3,399,709 | ||
| TOTAL SPECIAL EDUCATION EXPENDITURES | 870.5 | 86,413,854 | 857.4 | 85,232,357 |
| PROJECTED SURPLUS/(DEFICIT) | (1,231,944) | (885,880) | ||
"We have worked to align staffing, programming and operational decisions with projected enrolment while managing cost pressures and ensuring compliance with Ministry requirements. Within the Ministry's funding framework, we have focused on maintaining strong supports in our classrooms and schools, ensuring that students continue to have access to meaningful learning opportunities, high-quality programs and the services they need to succeed. The result is a balanced financial plan that supports stability and sustainability across the system."
DSBN's fiscal year runs from September 1 to August 31. Each June, the budget for the upcoming school year is presented and approved at the Regular Meeting of the Board.